ratanon.com - developer

How to debug in Mendix
Mendix มีคุณสมบัติในตัวสำหรับการดีบัก การดีบักเป็นสิ่งจำเป็นเพื่อหลีกเลี่ยงข้อผิดพลาดทางเทคนิคระหว่างรันไทม์ และเราสามารถทราบขั้นตอนที่แน่นอนของแอปพลิเคชันได้
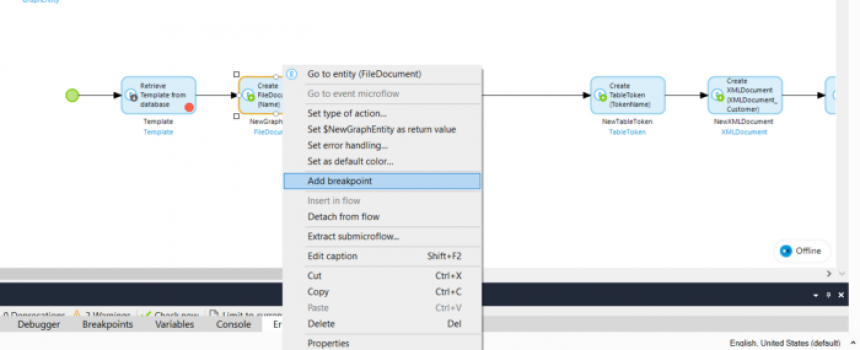
ในการเริ่มต้นแก้ไขจุดบกพร่อง คุณต้องเพิ่มเบรกพอยต์ให้กับไมโครโฟลว์
Checking Breakpoints:
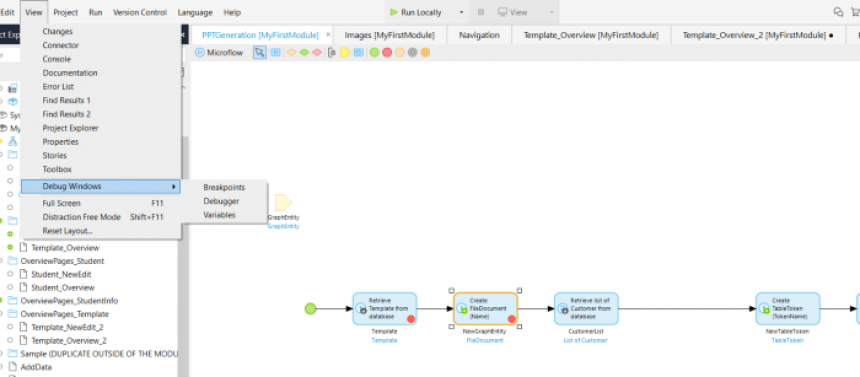
To check all the breakpoints we have a prebuilt option in Mendix. Click on View -> Debug Windows.
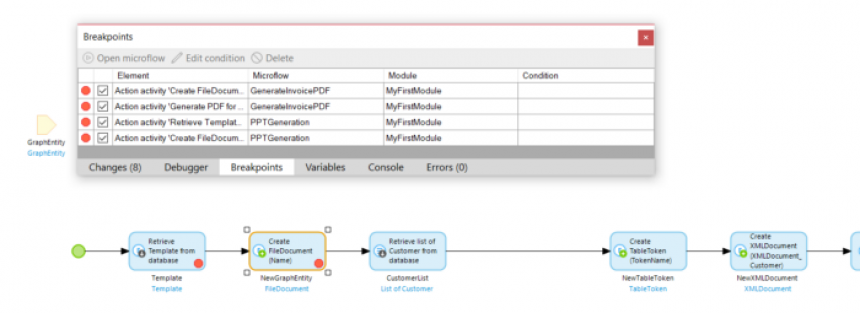
The breakpoint pane shows all the breakpoints of the microflow of the current application. After debugging don’t forget to remove breakpoints!!
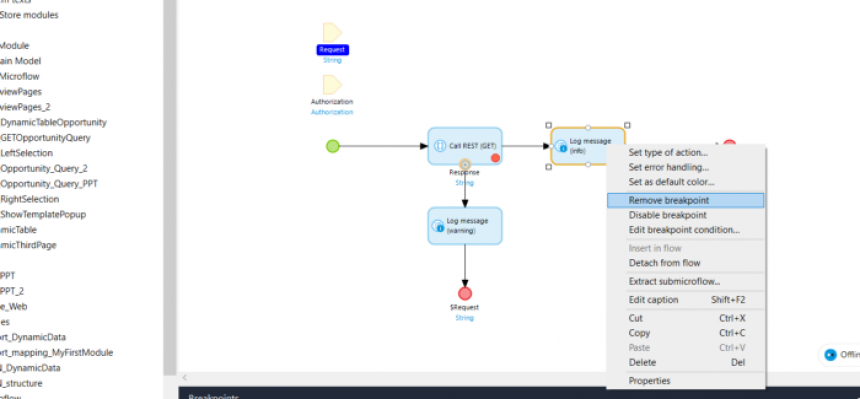
You can remove breakpoint from the breakpoint plane just deselect that activity of the microflow.
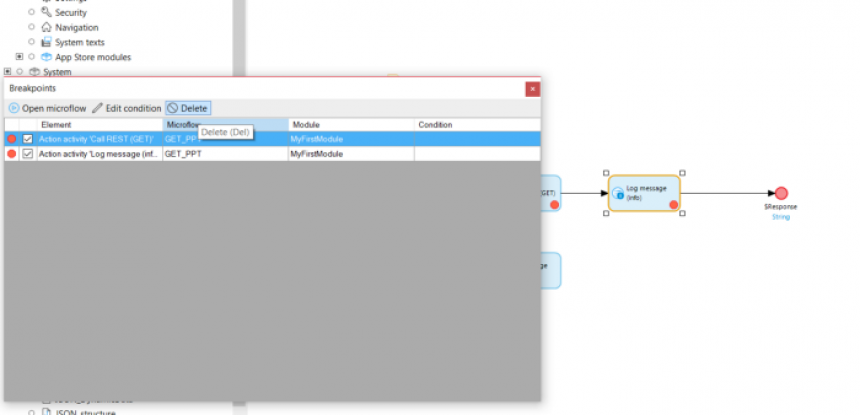
List of Breakpoints:
Click on run locally after development the breakpoint will halt the execution. This is very useful to analyze the execution flow and data up to the point. When the debugger triggers you will see the Mendix icon flashing on the taskbar.
Debugging pane:
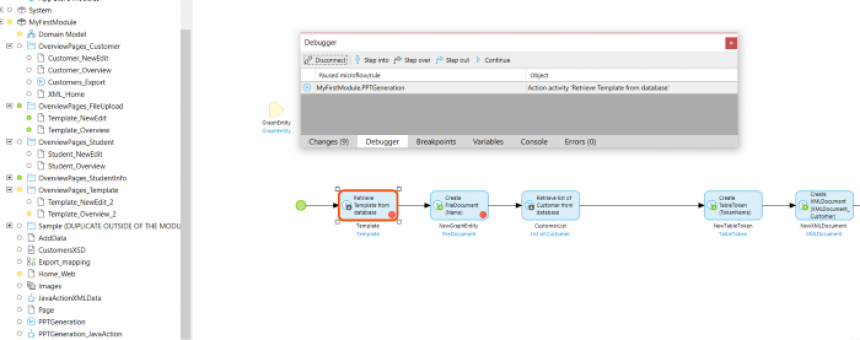
In the debugging pane you have 4 options: Step into, Step over, Step out and Continue.
Step Into: This means that the debugger steps into the sub microflow or loop.
Step Over: moves the debugger to the next step in a microflow.
Step Out: It is basically the opposite of Step into because step out instructs the debugger to leave sub microflow or loop.
Continue: debugger should continue until it reaches another breakpoint.
While debugging the application you can add breakpoint if you want to debug a particular activity. In the Breakpoint pane you can enable, disable, and delete breakpoints. Sometimes you need to configure a breakpoint so that microflow should trigger on a certain condition.
Variable Pane:
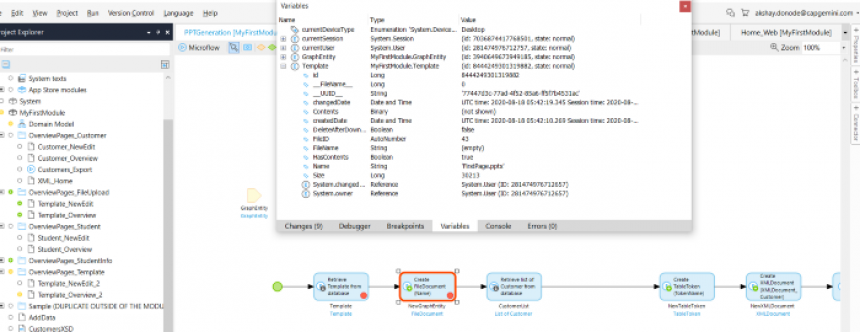
The Variable Pane shows the variables involved in the current microflow and their value as it changes through the microflow via the Debugger pane. It will show you all the information related to entities, references, current-user information, and device type also. The values are updated with every step you make in the Debugger.
After debugging you should remove all the breakpoint as shown in the image.
You can also remove all breakpoints from the breakpoint pane.
Debugging on Cloud:
First, open the project dashboard. Click on the Icon as shown in the image.

Click on Deploy > Environments > Show Debugger Information. After clicking this pop-up page is displayed with a URL and Password.
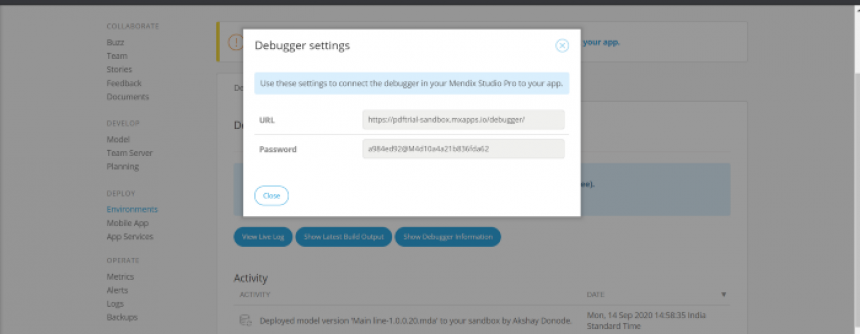
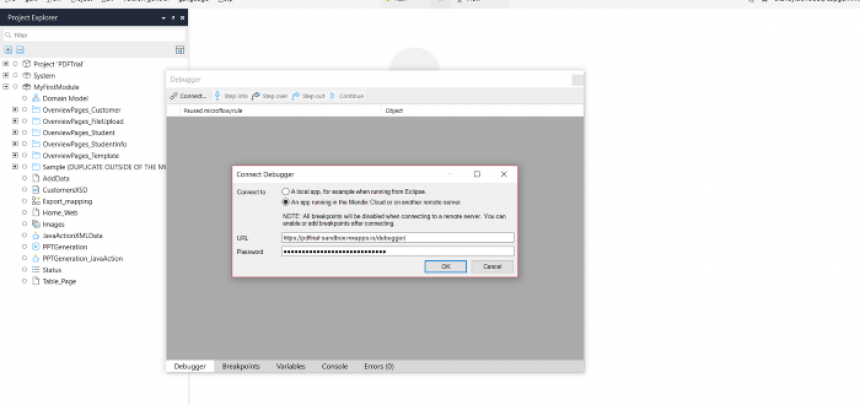
Now go to Mendix studio pro and open the Debugger pane and click on connect and fill in the URL and Password.
After a successful connection, the connect option will change to disconnect. Now add breakpoints to a microflow and deploy the application on the Mendix cloud.
Tip: Check breakpoints, after deploying on the cloud sometimes breakpoints are disabled.
Now hit the microflow (via button) to start debugging, you will see the Mendix icon flashing on the taskbar. Open Mendix studio pro and check the debugger.
Conclusion:
Debugging in Mendix is quite easy in both environments (Locally and on the Mendix Cloud) with just a few steps. The most important thing is when you start debugging open Debugger pane and Variable pane parallel. In the variable pane, try to understand all variables and how they change, in order to get a better understanding of what your logic is doing, and how to fix it.